In this article:
The Analysis Editor allows you to create and edit demographic splits, compares or recall any voting result(s) and choose which display type is used to present the results.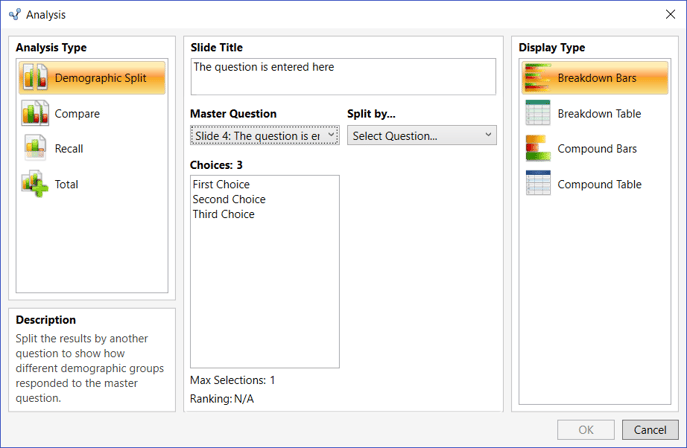
Controls
The Analysis Editor controls are contained within three main sections:
- Analysis Type
- Slide Title
- Display Type
Analysis Type
The left-hand section of the Analysis Editor screen allows you to choose the type of analysis that you wish to perform on your voting results. Every type of analysis requires a specific and individual approach to collecting and comparing your results. For every analysis slide a Master Question is selected and a subsequent second question(s) from the available voting slides. These choices provide the input to split, compare or recall any previous voting results.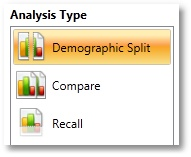
The Description panel provides an explanation of the currently selected analysis type.
There are four types of analysis functions available within Lumi ViewPoint:
| Icon | Analysis Type | Description |
| Demographic Split | Split the results by another question to show how different demographic groups responded to the Master Question. | |
| Compare | Show the results of two or more interactive questions that have the same number of choices or valid voting range in one combined chart or table. | |
| Recall | Shows the vote results to a polled question on another slide. | |
| Totals | Show the total result of several questions that have the same number of choices or valid voting range. |
Analysis Details
The middle section of the Analysis Editor screen allows you to select the question(s) that you wish to analyse.
Slide Title
This field will use the same the title text from the Master Question once it is selected. This text can then be kept the same or edited to be more appropriate to what is to be illustrated in this particular slide. Once set then the slide title remains the same if either the master question or type of analysis is changed.
Master Question
This drop-down menu will list all interactive questions that are available for analysis with the current presentation in order of slide number. The slide number and title texts from the question will be displayed to aid the referencing of multiple questions that may have similar titles.
All analysis types use the same master question control, meaning that the master question will remain set even if you change the analysis type. The Recall analysis only uses the master question, however the other analysis types involves selecting one or more additional questions to complete the slide.
Multiple Choice Questions
Below the question selection control the choice descriptions are displayed to help confirm that the correct question has been selected. Note that you cannot edit the choices within this control, this can only be done on the slide, or within the Question Editor.
If a multiple choice question has been selected as the demographic question within the 'Split by...' section then the choices are described as 'Legend Labels'. This is because each choice represents a different subset of the results. For chart displays, each subset is represented by a differently coloured bar/column or pie slice, which is accompanied by a legend or key.
As well as the choices, the Analysis Editor will also show whether the question allows multiple selections and/or ranking. This is helpful when comparing multiple sets of results because all of the selected questions must have the same voting rules.
Please note that multiple selection and ranking questions cannot be selected as the demographic question. This is because the audience would be able to place themselves into more than one demographic group, making the results appear as if more people voted than actually did.
Numeric Range Questions
When a numeric range question selected as either a master or demographic question, the Analysis Editor will display the upper and lower limits that have been set as the valid voting range for the selected question. Note that you can only change the range by editing the original question within the 'Question Editor'.
If a numeric range question is selected as a master question then you will also be able to add or edit the range descriptions that convey what the high and low values represent.
If a numeric range question is selected as the demographic question within the Split by section, then the the total number of displayed columns/rows (‘bands’) can be influenced based upon the selection in the drop-down within the 'Legend Labels' section. When the number of legend labels is changed then a preview is provided of how the range of numbers will be grouped together. The feature is useful in reducing the total number of columns or rows to make the display easier to interpret.
Comparison Questions
If the analysis type is 'Compare' then you will be able to select up to six other questions to compare with the master question. This is done by clicking on the 'Select Question' controls as they become enabled one-by-one within the 'Compare With...' section.
The valid voting range of master question will influence the availability of slides with which you can compare results.
You can compare...
- Up to six slides of the same question type.
- Multiple choice questions that have the same number of choices, even if the choice descriptions are different.
- Numeric range questions that have the same voting range.
- Multiple selection questions that have the same number of choices and allowed votes.
- Ranking questions that have the same number of choices and allowed votes.
- Compatible slides that have different questions (slide titles).
You CANNOT compare...
- Multiple choice questions with numeric range questions.
- Multiple choice questions with different numbers of choices.
- Numeric range questions with different valid voting ranges.
- Single choice, multiple selection and ranking questions with each other, even if they have the same number of choices.
The Analysis Editor provides additional information on question incompatibility when the mouse is hovered over any disabled slide when selecting a comparison question:
When comparing multiple choice questions then an 'Only show questions with matching choices' tick-box will be available within the 'Select Question' comparison controls. Activating this tick-box will disable the interactive questions that do not have the exact same choice descriptions as the master question. Please note that this feature is case-sensitive.
Comparison Legend Labels
Each selected question for a comparison slide has a corresponding 'Legend' control. These editable text field provides a short description of each question that show what responses represent each different question. Each legend field has a default description that corresponds to the order in which each question is selected, i.e. "1st Vote", "2nd Vote", and so on. You can easily change the legend labels to better match the context of your question. For example, to compare the audiences' opinions on a topic at the start and the end of a meeting, you could change "1st Vote" to "Morning" and "2nd Vote" is to "Afternoon".
Display Type
The right hand side of the Analysis Editor provides a selection of the available display types, which is dependent upon what the currently selected analysis type and master question are, as shown below:
| Analysis Type | Question Type | Display Type |
| Demographic Split | Numeric Range | Breakdown Columns & Breakdown Table |
| Compare | Multiple Choice | Breakdown Bars & Breakdown Table |
| Compare | Numeric Range | Breakdown Columns & Breakdown Table |
| Recall | Multiple Choice (Single Selection) | Bar Chart, Pie Chart & Table |
| Recall | Multiple Choice (Multiple Selection or Ranking) | Bar Chart, Pie Chart, Table, Breakdown Bars & Breakdown Table |
| Recall | Numeric Range | Column Chart, Table & Calculated Values |
| Demographic Split | Multiple Choice | Breakdown Bars & Breakdown Table |
General Controls
| Button | Description |
| OK | Creates a new analysis slide or applies changes to an existing analysis slide. |
| Cancel | Exits the Analysis Editor screen without creating a new analysis slide or saving any changes. |

Reviewed and Approved by Product Team